RoboTaxi – a Distributed Real-time System for Autonomous Taxis
Pollution caused by the combustion of fossil fuels leads to global warming and acid rain. The continued, routine use of destructive fossil fuels is unnecessary now that there are alternatives. The automotive industry has a responsibility to devote more resources and research into technological alternatives to unsustainable practices. Thankfully, car manufacturers have begun to address this problem through a research field called smart mobility.
In practice, smart mobility means customers (or car drivers) who share driverless electric vehicles; unfortunately, sharing resources like cars and buses goes against our society’s mega-trend toward individualization and egoism. To overcome this conflict of interest and achieve widespread success, “smart services” able to understand the customers’ mobility patterns and take them into consideration for predictive analytics and optimization are key.
To achieve this lofty goal, we must first understand how large amounts of geo data can be used to derive historical mobility patterns, based on which sophisticated predictive analytics mechanisms can deliver added value in real-time. In this context, added value for the customers means, for example, giving advice regarding the best place to hail a taxi.
Leveraging the results of my PhD thesis and New York’s open taxi data set from 2013, this blog post explains for the first time how a hypothetical service of autonomous taxis called RoboTaxi (since it is a distributed version of UBER) could be set up.
What is Smart Mobility and why is it important for car manufacturers?
As some of you may know, I joined Volkswagen commercial vehicles (VW’s division for small and light trucks) in November 2016. I started my career at Volkswagen research in 2011 after my PhD. The last two years I headed a team in Berlin developing a big data analytics dashboard that was released under wao.io. After completing this project, I was eager to return to Volkswagen, since its future is too interesting not to be a part of it.
In the last few months, the following epoch-making changes took place at Volkswagen. First, the modular electric drive (MEB) platform was set up. MEB consists of three key elements: a substantial battery pack integrated into the floor structure, forward-mounted power-control electronics, and a powerful electric motor.
Second, I.D. concept cars were released such as the I.D. buzz or the Roboter Taxi Sedric, based on the idea of an overall Volkswagen ID (very similar to the Apple ID). The Volkswagen ID is a sophisticated personalization concept. The idea is that anyone who drives a Volkswagen in the future will be given their own Volkswagen ID. The ID is an individual profile, in which the personal seat and air conditioning settings, favorite radio stations and songs, sound system settings, exterior sounds, configuration of the navigation system, and type of ambient lighting, as well as the contact details of the driver's friends and business associates, are saved. This profile can be securely accessed via the cloud, enabling the I.D. to recognize the legitimate user by their smartphone - the Digital Key - and know who is about to get behind the wheel. With the I.D. you'll be at home on the road because, with Volkswagen Home-Net, it will be possible to interconnect your car and home. For example: using cameras in the house you will be able to check whether everything is fine at home from the car. In case a family member has forgotten her key, she can look into the camera, and I.D. sends the picture to the Active Info Display, so that the driver can open the front door using an app. This type of I.D. can therefore help to address the conflict of interests to individualize shared cars.
Third, a new brand called RIO was created at MAN trucks and buses. In October 2016, at the famous automobile ferry IAA, Volkswagen truck & bus launched the RIO platform. RIO is a cloud-based operating system for the logistics industry. RIO’s first killer application will be an app called LoadFox– a ridesharing app for freight. This is just the first application of many others in the field of prediction and optimization.
As you can see, everything is moving towards smart mobility, which represents a real step forward for the industry. Let’s have a closer look what we need beside autonomous cars to create such services from an IT perspective.
Creating smart data-driven services (such as RoboTaxi)
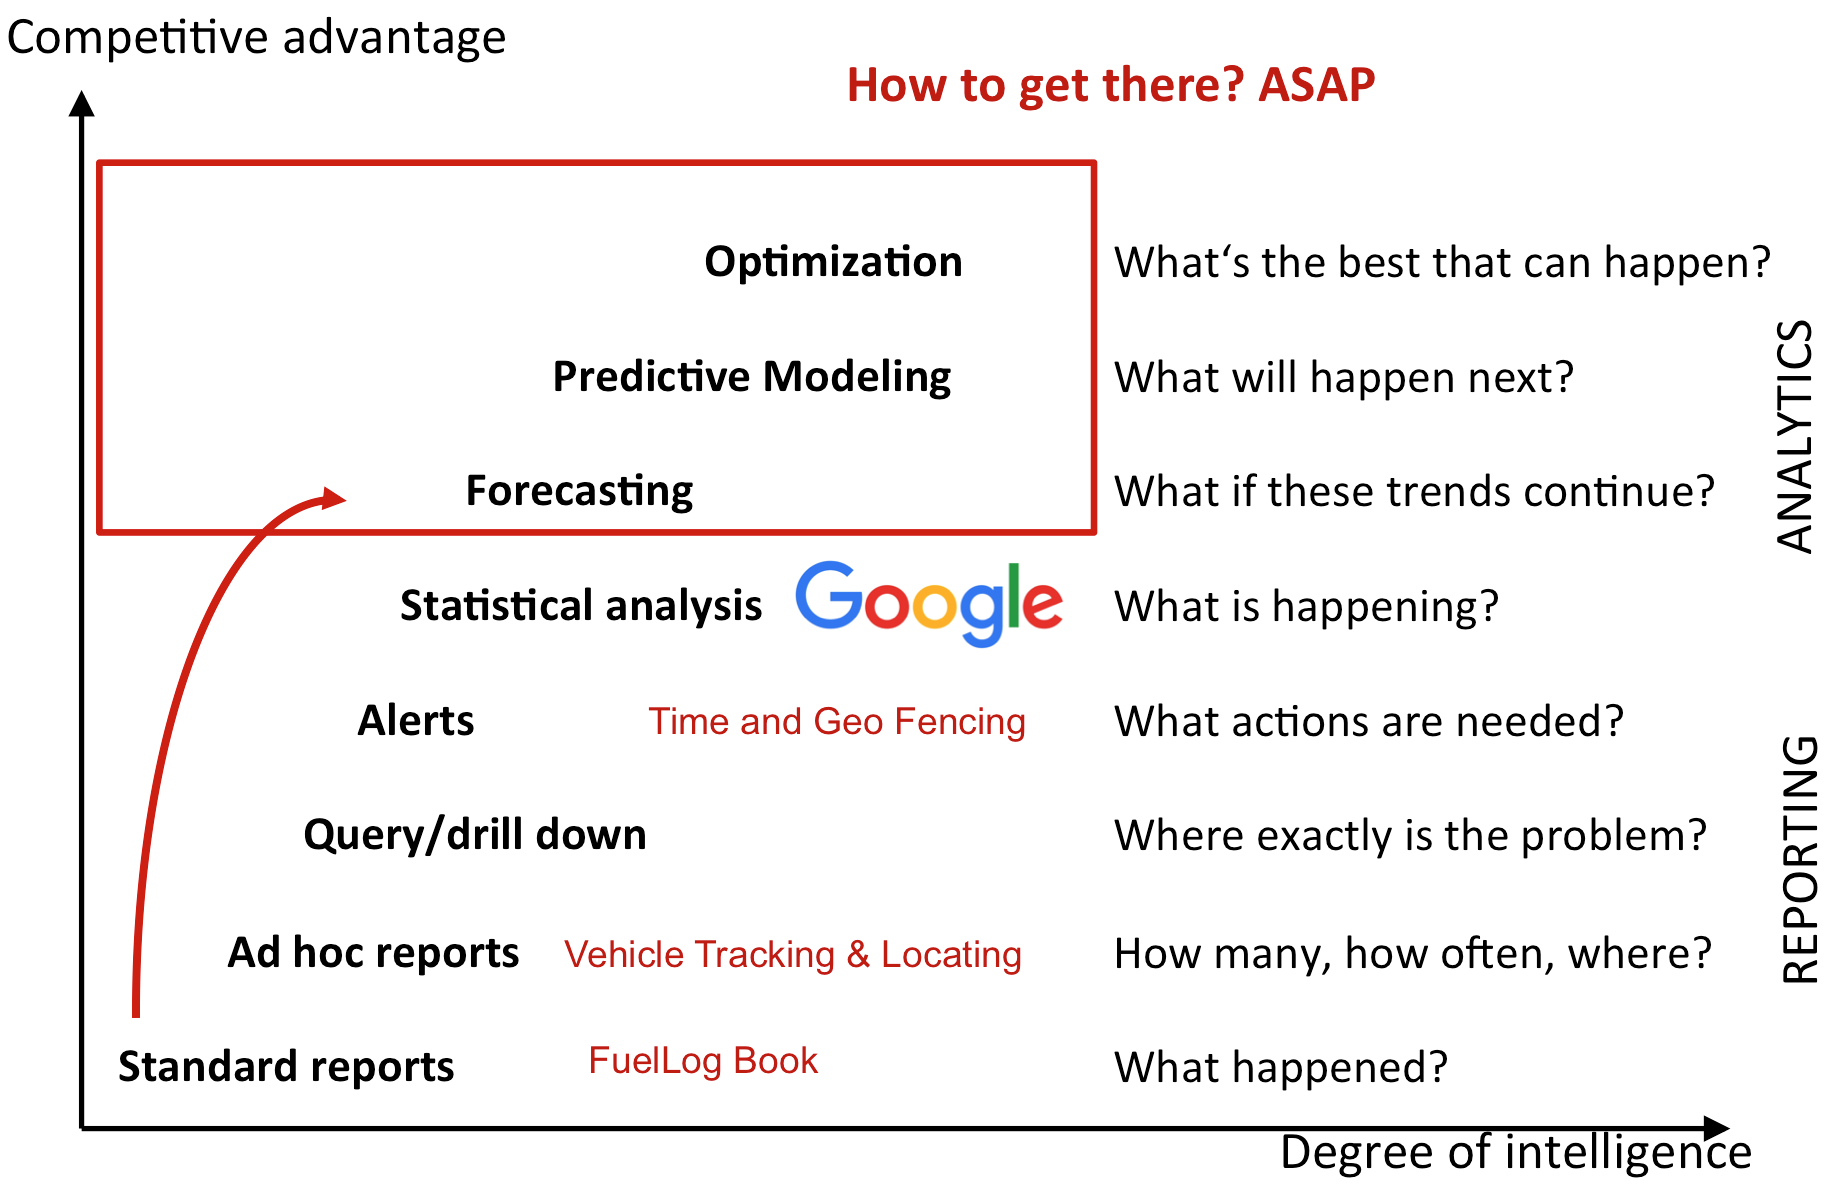
In general, automotive use cases for smart mobility can be linked to one of the sections displayed in the table above. Let’s have a closer look what this figure can tell us. The lowest competitive advantage comes from use cases in the access and reporting fields. Here, we only look at historical data and try to understand what happened and count how often and so on, that is, old school business intelligence. This could be a driver’s digital logbook (which is needed, for example, in Germany to get a reimbursement of tax if you are owner of a company car) or a scoring service that analyzes your driving behavior. Nevertheless, this data can be the basis for more sophisticated analytics. The more sophisticated the analytics are, the more complex the service they can provide, while also improving competitive advantage.
To give a concrete example: Optimizing your electric vehicle’s route to cover all meetings in your calendar and incorporating current weather conditions (such as headwind or an incline in the route) to estimate battery use and plan visits to charging stations between your meetings is a highly complex service in the optimization section. Since analyzing large amounts of geospatial data will be the basis for understanding mobility patterns and more sophisticated services, this will be our first requirement. These are the types of challenges we’ll also have to meet for our distributed taxi service.
So, our service must be predictive and optimizing, that is able to process data in real-time. We want to create a distributed system called RoboTaxi. RoboTaxi is able to drive passengers from A to B autonomously. It is a mixture of Uber and LoadFox, since we want to deliver our passengers on their shortest route but with optimal cost and an overall high utilization rate. Customers can request a taxi via an app. The request consists of:
- a time (the ordering time)
- two geo-locations, where I should be picked up and dropped off,
- the number of passengers,
- and no passenger (or group of passengers) should wait longer than 3 minutes to be picked up.
The taxis take these requests into consideration and start planning their next route according to all incoming requests. The goal is to satisfy all customer needs at minimal cost. Planning such routes under constraints with an optimization goal is very similar to the famous vehicle routing problem. The vehicle routing problem is a combinatorial optimization problem which asks "What is the optimal set of routes for a fleet of vehicles to traverse in order to deliver to a given set of customers?" Determining the optimal solution is an NP-hard problem in combinatorial optimization, so the size of problems that can be solved optimally is limited. Our requirement of solving it in real-time and distributed (that is, with no central entity), makes it even more challenging. We want to do it in a distributed manner in order to pave the way for scalability and robustness of the system. The taxis decide whether to accept a request or not and inform the other taxis in order resolve conflicts, as for example, when two taxis decided to accept the same request at the same time.
This problem is very similar to the one addressed by my PhD thesis, which focused on dynamic reconfiguration of active camera networks. Instead of taxis evaluating customer requests and planning routes, I investigated how active cameras planned their routes to observe so called “moving targets” in a surveillance area. So, the targets are the customers in our service and the active cameras are the taxis. The requests via the app, which include geo locations for pick ups and drop offs, ordering times and the number of passengers, are the request which were released by so-called observer nodes in my PhD thesis.
We assume that our taxis (based, for example, on the new VW I.D. Buzz or the Roboter Taxi Sedric) drive autonomously and plan their routes on incoming picking up requests from customers. The I.D. Buzz has eight seats. New York will be the first city where we’ll launch our hypothetical distributed taxi service called RoboTaxi, since someone has already done our homework there and collected sample data for one year for all taxi trips. Let’s analyze this data set to get some insights.
How can we analyze large amounts of geospatial data to gain historical data?
We’ll set up a distributed architecture for the real-time planning task. First, we’ll have to look at how to analyze geo-spatial data in a scalable manner. For this, we’ll use the open-source software Apache Spark. This enables us to answer the questions like “What happened?”, “How many, how often, where?”, “Where exactly is the problem?”, “What actions are needed?”
Before setting up our service, we’ll thoroughly analyze the New York taxi fare data from January 2013 to January 2014 (approx. 24 GBytes). This data is available for free and should yield enough usable information. Each row of the file after the header represents a single taxi ride in CSV format. For each trip, we have the following:
- unique id of the taxi
- unique id of the driver
- temporal information about the trip (start and end time),
- spatial information about the trip (the position with longitude and latitude coordinates where the passenger(s) entered and left the taxi).
If you’re interested in replicating my experiment, note that I took the code for the following analytics from the “Advanced Analytics with Spark” book from O’Reilly and set up an AWS EMR Spark 1.3.1 cluster of 3 m3.xlarge nodes with 45 GByte RAM. It took 10 hours and cost $20. All data (approx. 24 GByte) was stored in an S3 bucket.
First we want understand where taxi trips start and end and how this impacts the taxi drivers’ utilization. In order to get these results, we’ll do the following with our Spark cluster:
- Map the start and end positions to boroughs in New York such as Manhattan, Brooklyn, etc. This can answer basic questions such as what happened, how often and where.
- Investigate the relationship between the borough in which a driver drops his passenger off and the amount of time it takes to acquire another fare. This is relevant in order to understand the overall utilization of taxi drivers.
To carry out this analysis, we must be able to handle two sorts of data types: temporal data, such as dates and times, and geospatial information, like points of longitude and latitude and spatial boundaries. For temporal data, there is a great library which has been developers’ go to for many years: The JodaTime library. There is also a Scala wrapper library called NScalaTime, which provides some additional syntactic sugar for working with JodaTime in Scala. Regarding data analysis problems, we usually need to convert some string representation of data into a DateTime object on which we are able to perform our calculations. We often want to do temporal arithmetic such as finding out how many seconds, hours or days separate two dates. JodaTime handles all of the tedious details of different time zones and quirks of the calendar like Daylight Saving Time so that we don’t have to worry about them.
Concerning geospatial data, the solution isn’t so simple. There are plenty of different libraries and tools which have different functions, states of development, and maturity levels. First, we have to identify what kind of geospatial data we want to analyze. We usually have to cope with two kinds: vector and raster data. Regarding the taxi trip data, we have longitude and latitude records and vector data stored in the GeoJSON format that represents the boundaries of New York’s different boroughs. So, we need a library able to parse GeoJSON data and can handle spatial relationships such as whether a given geo data point (a pair of longitude and latitude) is in a borough described by a surrounding polygon. Fortunately, there is an open source library from the book “Advanced Analytics with Spark” covering our requirements. The data we’ll use for the boundaries of boroughs in New York City is in GeoJSON (the file is named nyc-boroughs.geojson). For each borough in New York it displays a polygon representing the boundaries of the borough, and the properties containing the name and other related information.
Now we try to answer the second question, that is, to investigate the relationship between the borough in which a driver drops his passenger off and the amount of time it takes to acquire another fare. To understand the economics of logistics we must statistically analyze utilization: the fraction of time that a vehicle (such as a taxi) is on the road and delivering load (passengers in our case). One factor which impacts utilization is the load’s destination: a taxi which drops off a fare near Manhattan is much more likely to find its next passenger in just a few minutes, whereas a taxi which drops some passengers in Staten Island (in the middle of nowhere) may have to drive some way before it finds the next one. Our goal is to quantify these effects and dynamics. Specifically, we want to quantify the time it takes to find the next fare as a function of the borough in which the taxi dropped its previous client off.
You could even adapt this service for the logistics industry. This could be an interesting feature for RIO’s LoadFox service. Based on historical data, the probability could be computed to find the next load depending on the city where the last load was dropped off.
Let’s do the analytics on our data set and examine the results:
| #Trips | % | Mean downtime (s) | |
|---|---|---|---|
| Manhattan | 145,082,478 | 90.16 | 593 (< 10 minutes) |
| Brooklyn | 8,089,948 | 5.03 | 1,309 (22 minutes) |
| Bronx | 685,517 | .43 | 1,985 (33 minutes) |
| Queens | 7,038,356 | 4.37 | 2,303 (38 minutes) |
| Staten Island | 27,373 | .02 | 2,965 (49 minutes) |
As presented in the table above, the vast majority of fares are in Manhattan. This is no surprise; it is why outer boroughs have their own alternative to licensed taxis – so called gypsy cabs and inexpensive vans and car services. And as you can easily see, taxi drivers have a major financial incentive to discriminate among passengers based on their final destination. This is actually a huge problem in NYC. Friends of mine who lived there confirmed that they’ve been thrown out of cabs for wanting to go to Brooklyn or Queens. Drop offs in Staten Island, especially, involve an extensive amount of downtime for a driver, and therefore have a negative impact on the taxi driver’s wallet. This is one reason why many people prefer using apps like Uber and Lyft.
Based on this data, the following services/applications come to my mind, which are not very complex to develop:
- For taxi drivers: A recommendation app which recommends the best place for a driver to go after a drop off, based on the current traffic patterns from Google Now and the historical record of next-best locations which is already contained in our data set.
- For passengers (not using Uber or Lyft yet): A CabCatch app which recommends based on the given current time, place, and weather data, what is the probability to hail a cab from the street within the next five minutes.
- For car manufactures: A LastMilePark app. This app helps you to find the best parking spot with the highest probability to hail a cab from the street within the next five minutes.
But for now let’s focus on our use case of a distributed system of autonomous taxis. We conclude that we’ll need the majority of our taxis in Manhattan, since we’ll achieve the highest utilization there, and avoid long drives to boroughs such as Staten Island. Furthermore, we can use the data set in order to determine the best starting positions for our taxis in the morning, but these analytics are beyond the scope of this blog post.
A distributed real-time architecture for RoboTaxi
As we saw from the data discussed above, we should have the majority of our taxis in Manhattan to ensure the highest utilization.
RoboTaxi should be massively scalable and real-time. All of these properties are important for us, so we can easily add or remove new taxis to the system and respond to customer requests with minimal delays. Usually you have to set up many streaming servers (running Apache Spark Streaming or Apache Flink) in order to respond in real-time. Since our calculations are all done in the taxis, we don’t need such a cost-expensive infrastructure – a big plus for us. Additionally, our architecture paves the way for heterogeneous taxi networks consisting of different car brands and types. Furthermore, car owners could put their autonomous cars to work— when they do not need them—to earn money for them. After driving to work, for example, I could add my autonomous car to the RoboTaxi network by activating a small device in my car, pushing the RoboTaxi button or starting the RoboTaxi taxi driver app. This would start the planning algorithm, which would accept requests from clients. Read on for a closer look on how the planning algorithm in the car works.
RoboTaxi is a distributed control and planning algorithm of cooperating autonomous taxis. The basic idea of RoboTaxi is that a set of autonomous taxis collaborates to bring passengers from A to B at minimal cost while satisfying all of their requirements (such as the picking up and drop off location as well as the time when a taxi is ordered). The taxis’ control is based on data generated by an app. In the same app, passengers can request to be picked up. The main goal is to satisfy all requests with minimal cost. Requests should be accepted by only one taxi within 3 minutes.
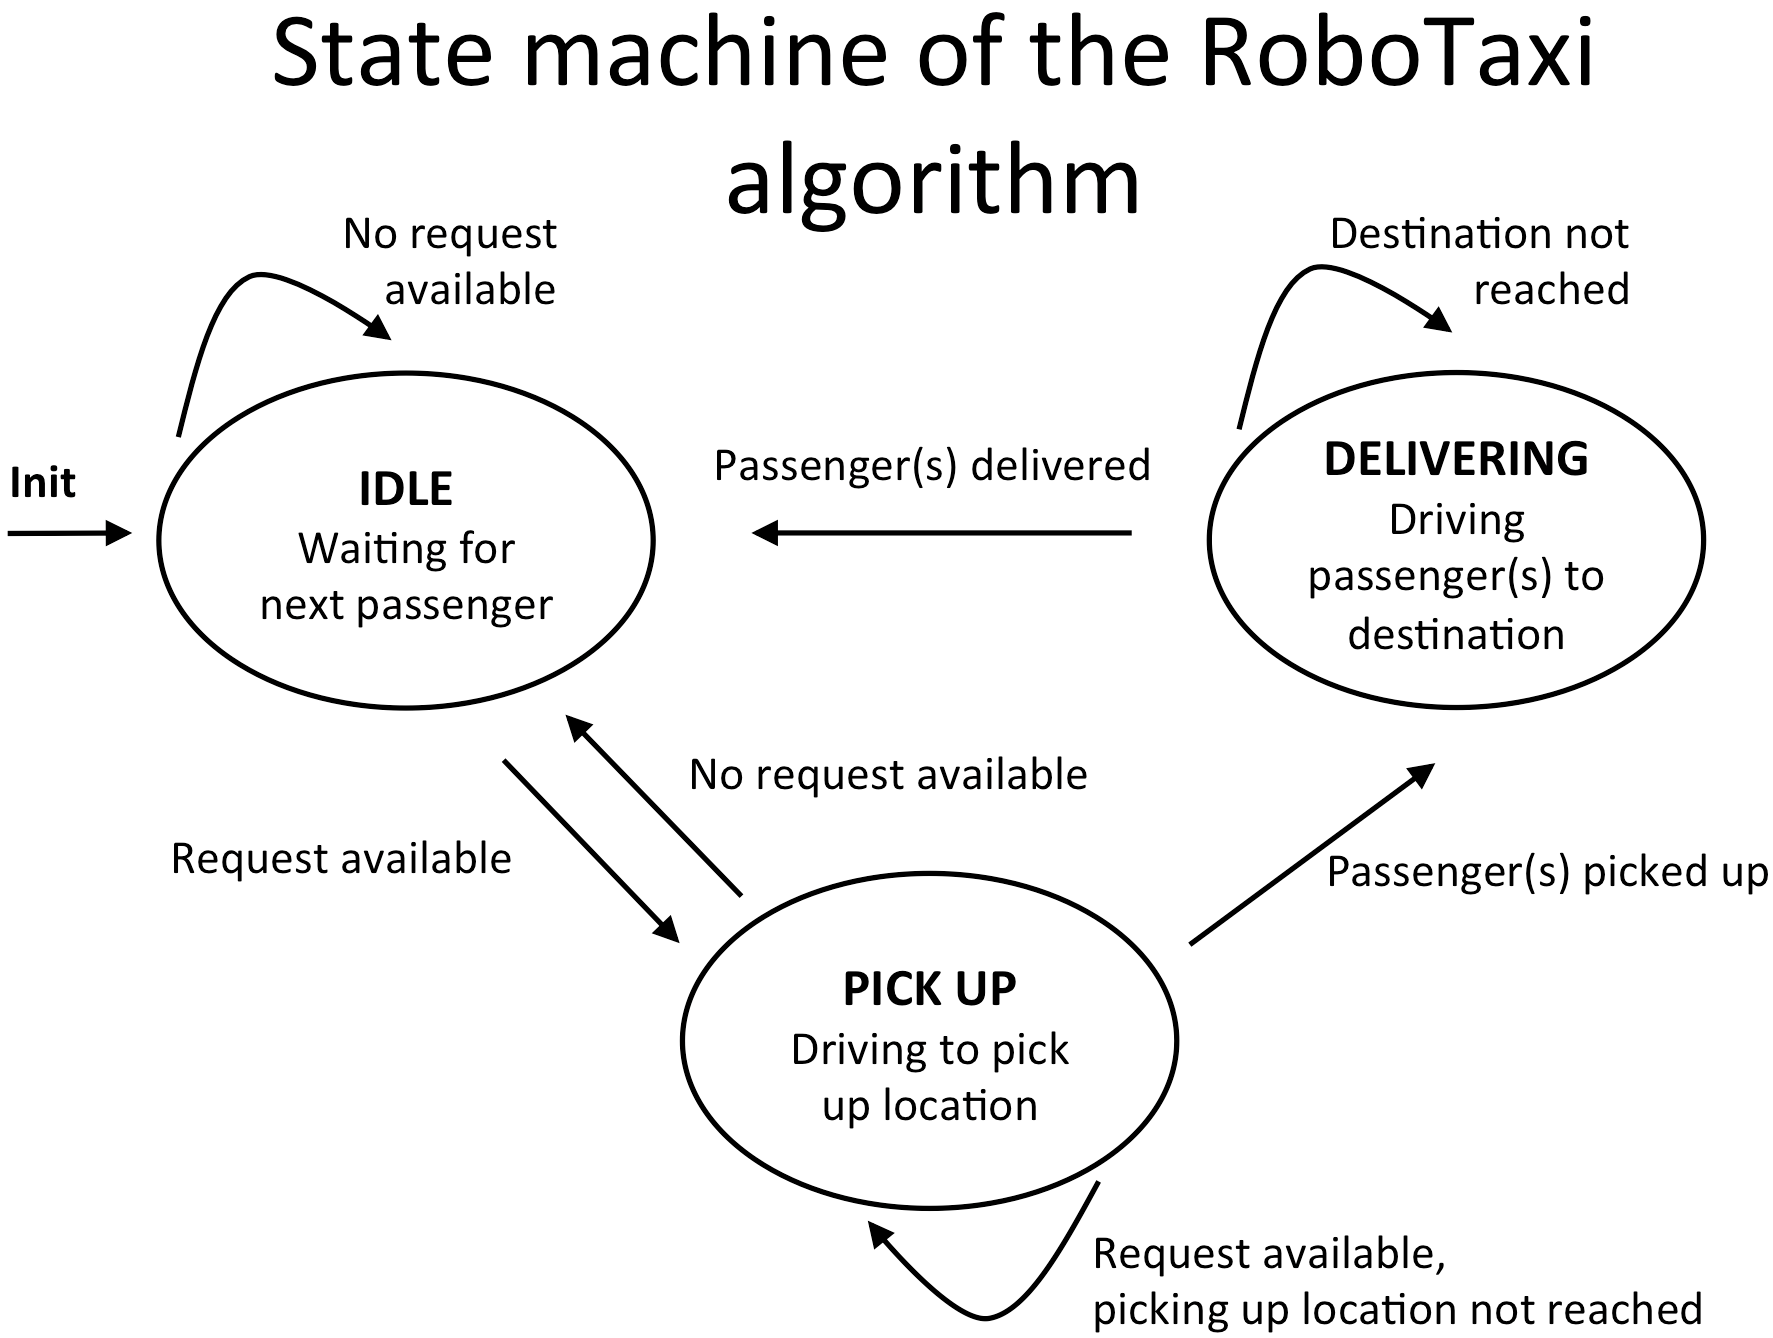
RoboTaxi is based on a state-machine which will be described in detail in the following. The figure above shows an overview about the different states of the state-machine. A timer is initiated and the autonomous taxi is set to IDLE mode while waiting for pick up requests. If the timer expires, all requests, which were dispatched by clients via the app, are processed in order to find the next delivering task. This could mean the most-promising request with minimal cost for the taxi, as defined by time spent driving. This is achieved by executing a local quality function consisting of several sub functions. For example, to evaluate the taxi’s distance to the pick up location, the distance to the drop off location and the period of time the passenger already waits for a taxi. A timer is chosen in order to reduce CPU load by triggering the scheduling process every 30 seconds. Thus, it allows for scalability in overloaded scenarios. In case a request is found exceeding a pre-defined quality threshold, the taxi changes to PICK UP mode. In this mode, the taxi informs all other taxis about its intention to pick up and deliver the passenger and starts driving towards the passenger to pick them up. After arriving, the taxi enters DELIVERING mode in order to bring the passenger to their desired destination. Afterwards, it returns to IDLE mode.
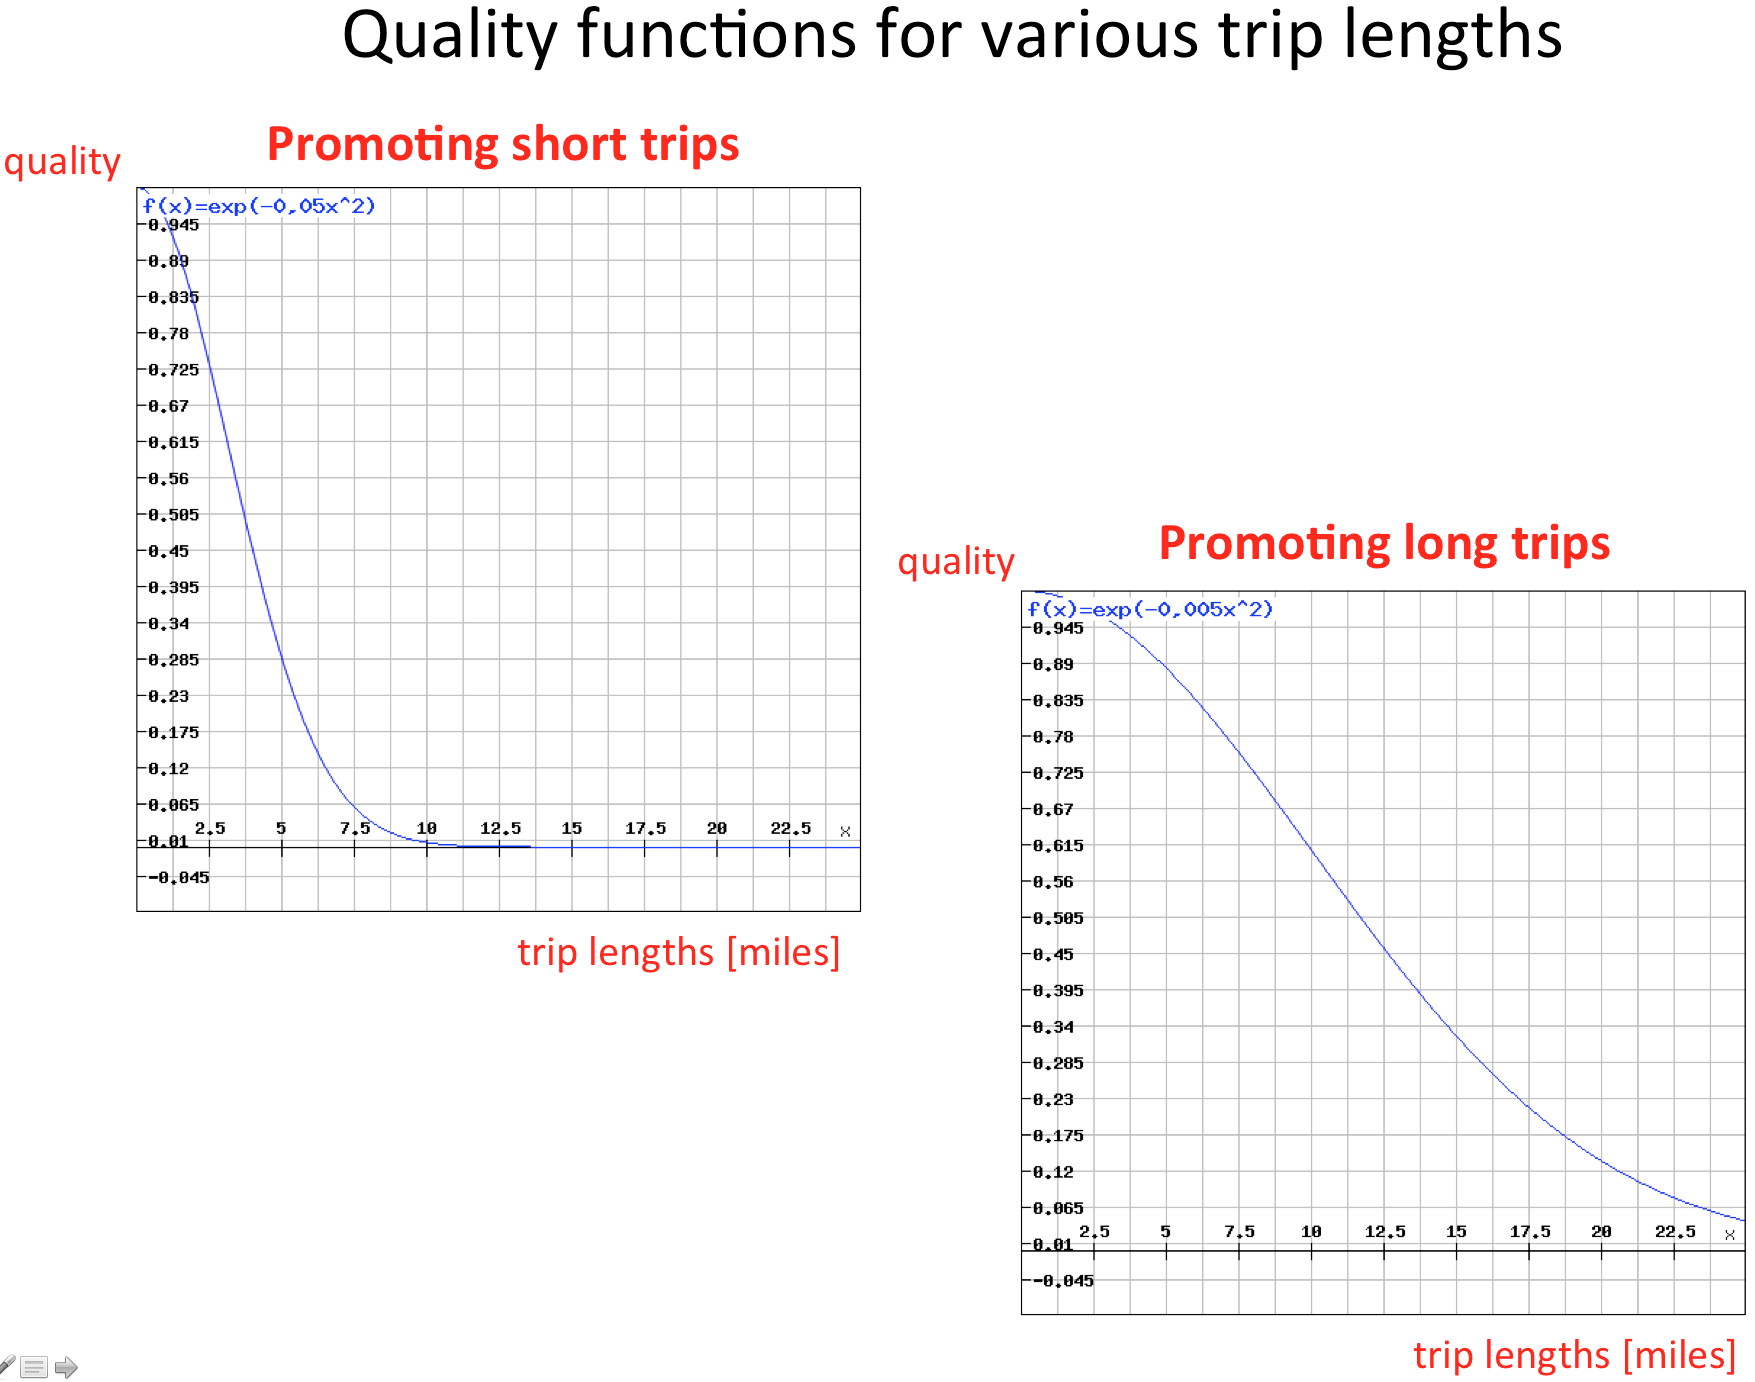
As already mentioned, all requests, which have not been accepted by another taxi, are examined by every taxi based on a quality function. For this purpose, the distance between the taxi’s starting point and the location of the request is computed. The owner of the car could configure their car’s settings to accept either short or long distance trips. If the car will only go for short trips, it can guarantee the owner a small delay in case they need it. If accepting long distance trips, the car can earn more money since it will probably have a higher utilization. For both use cases you find quality functions in the figure below.
Since no client should wait longer than 3 minutes to be picked up, the according quality function is shown in the figure below on the right side.
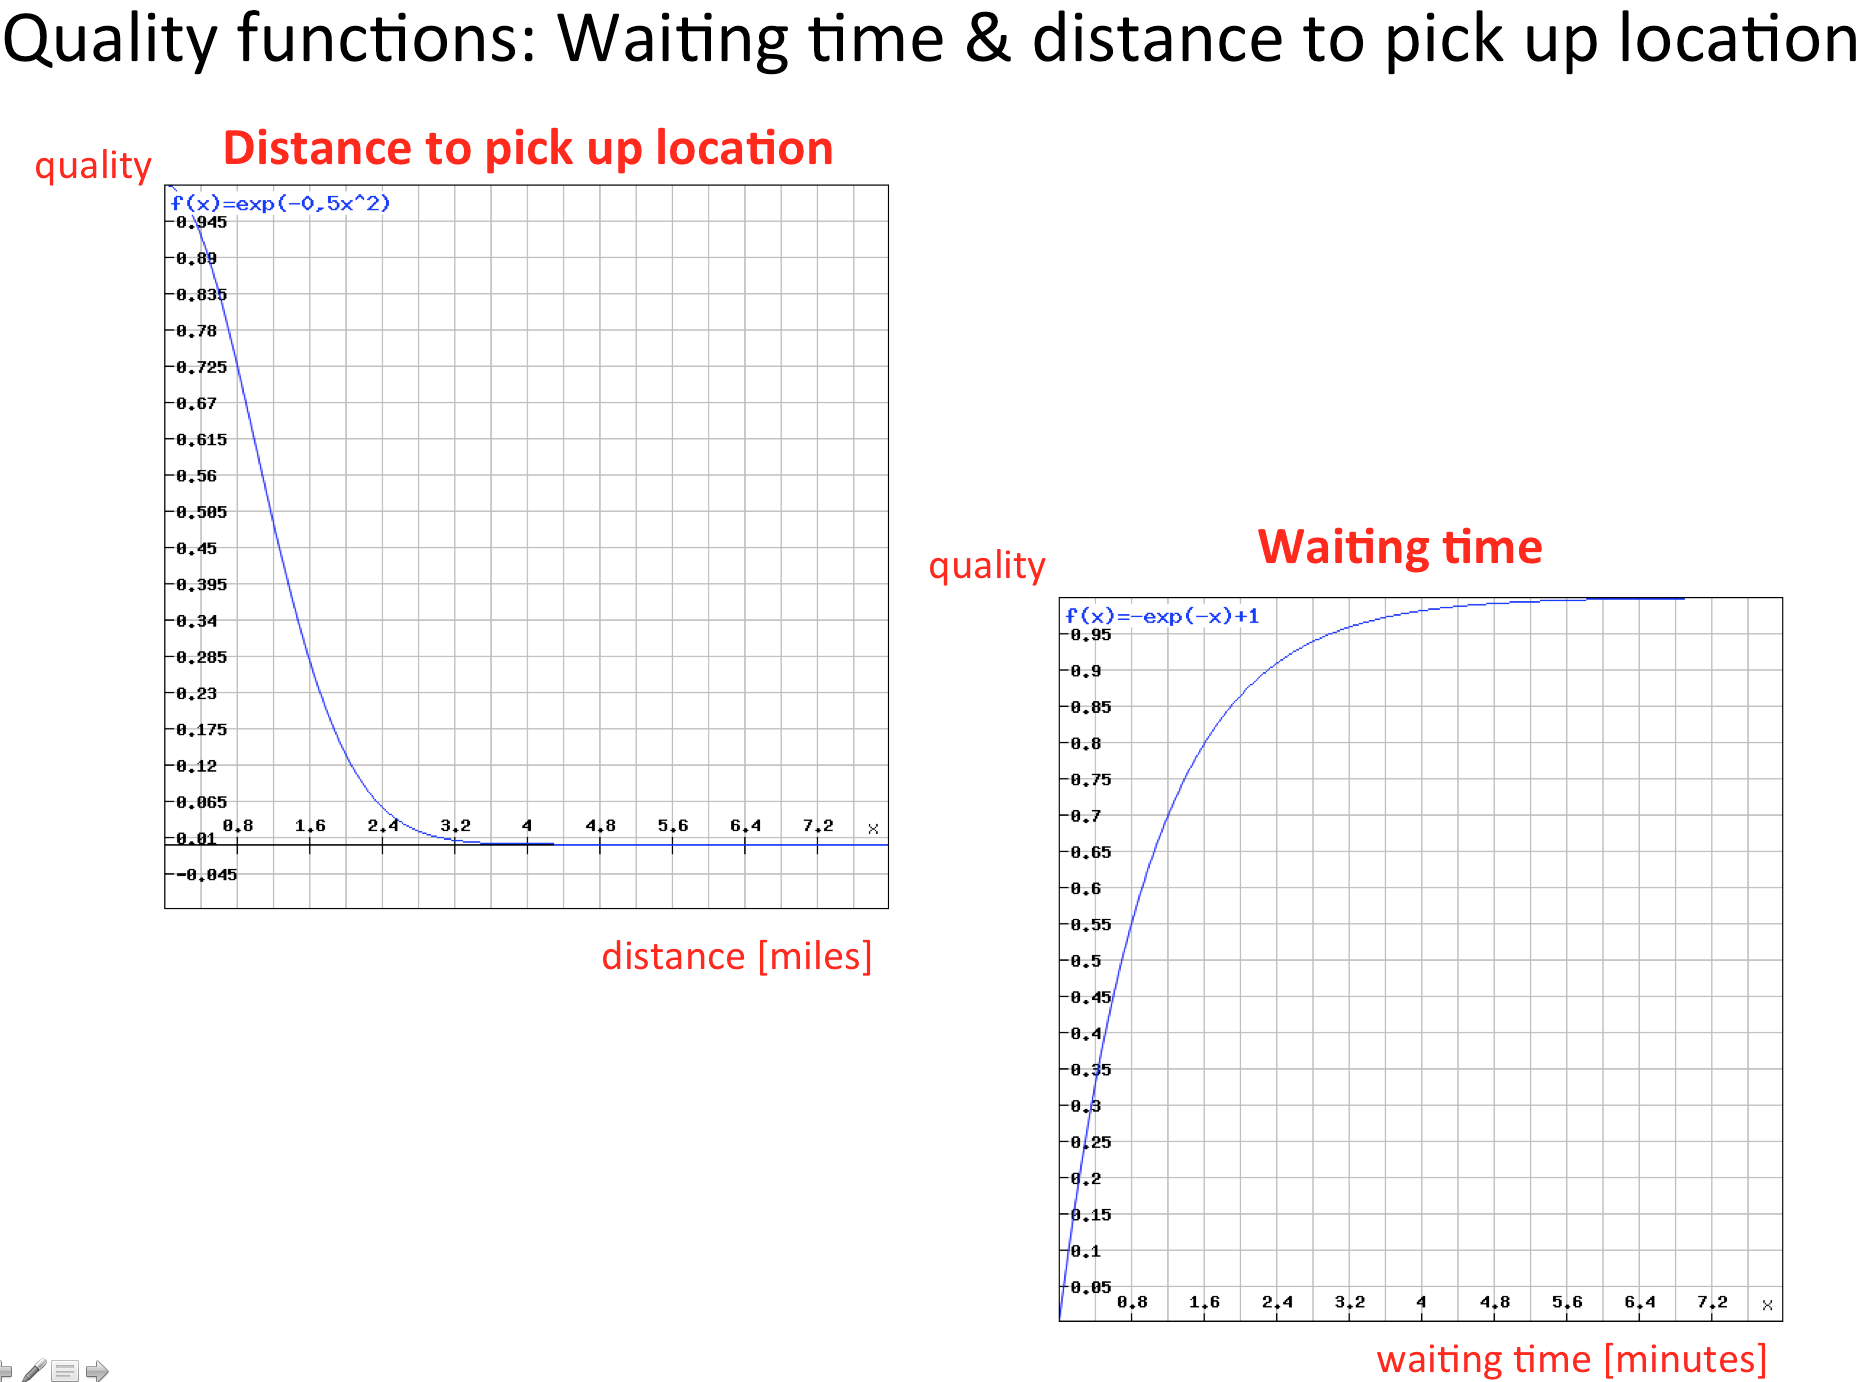
Requests with a waiting time higher than 3 minutes receive a quality rating near to one by this function. On the left side you see that requests with a distance below 3 miles are preferred. In order to maximize the utilization in the network, the number of passengers could be an additional factor of our quality function. The overall quality for every request is computed as the product of all quality sub functions, that is:
Q (per request) = quality of distance *** quality of waiting time * quality of trip length ( * number of passengers)
Conclusion
Smart mobility means enabling customers to share driverless electric vehicles. But to establish a scalable model for sharing cars (or buses), that is resources, designers should borrow methods and techniques from the complex machine learning field of predictive analytics and optimization.
This blog post showed how this complex problem can be solved by implementing a distributed system for autonomous taxis – called RoboTaxi. First, we analyzed the New York’s taxi data set in order to understand the customers’ mobility pattern and deduce the overall taxis’ utilization. Second, based on this information, we set up a distributed system of autonomous taxis accepting user requests in real-time and planning optimal routes only by taking local information into consideration. Setting it up in a distributed manner paves the way for a highly scalable and robust heterogeneous taxi network.
Edit: Have also a look at this interesting data set